ZIP code
76230
Bowie, TX
76230 covers Bowie in Montague County, with 9,885 people in the ACS 2023 estimate.
Figures are for the Census ZIP Code Tabulation Area (ZCTA), which is not the same as a USPS ZIP code. A PO Box or unique ZIP may have no ZCTA and no demographics. Methodology
U.S. Census Bureau, ACS 2019–2023 5-year (vintage 2023). Geography: ZCTA 76230. Methodology
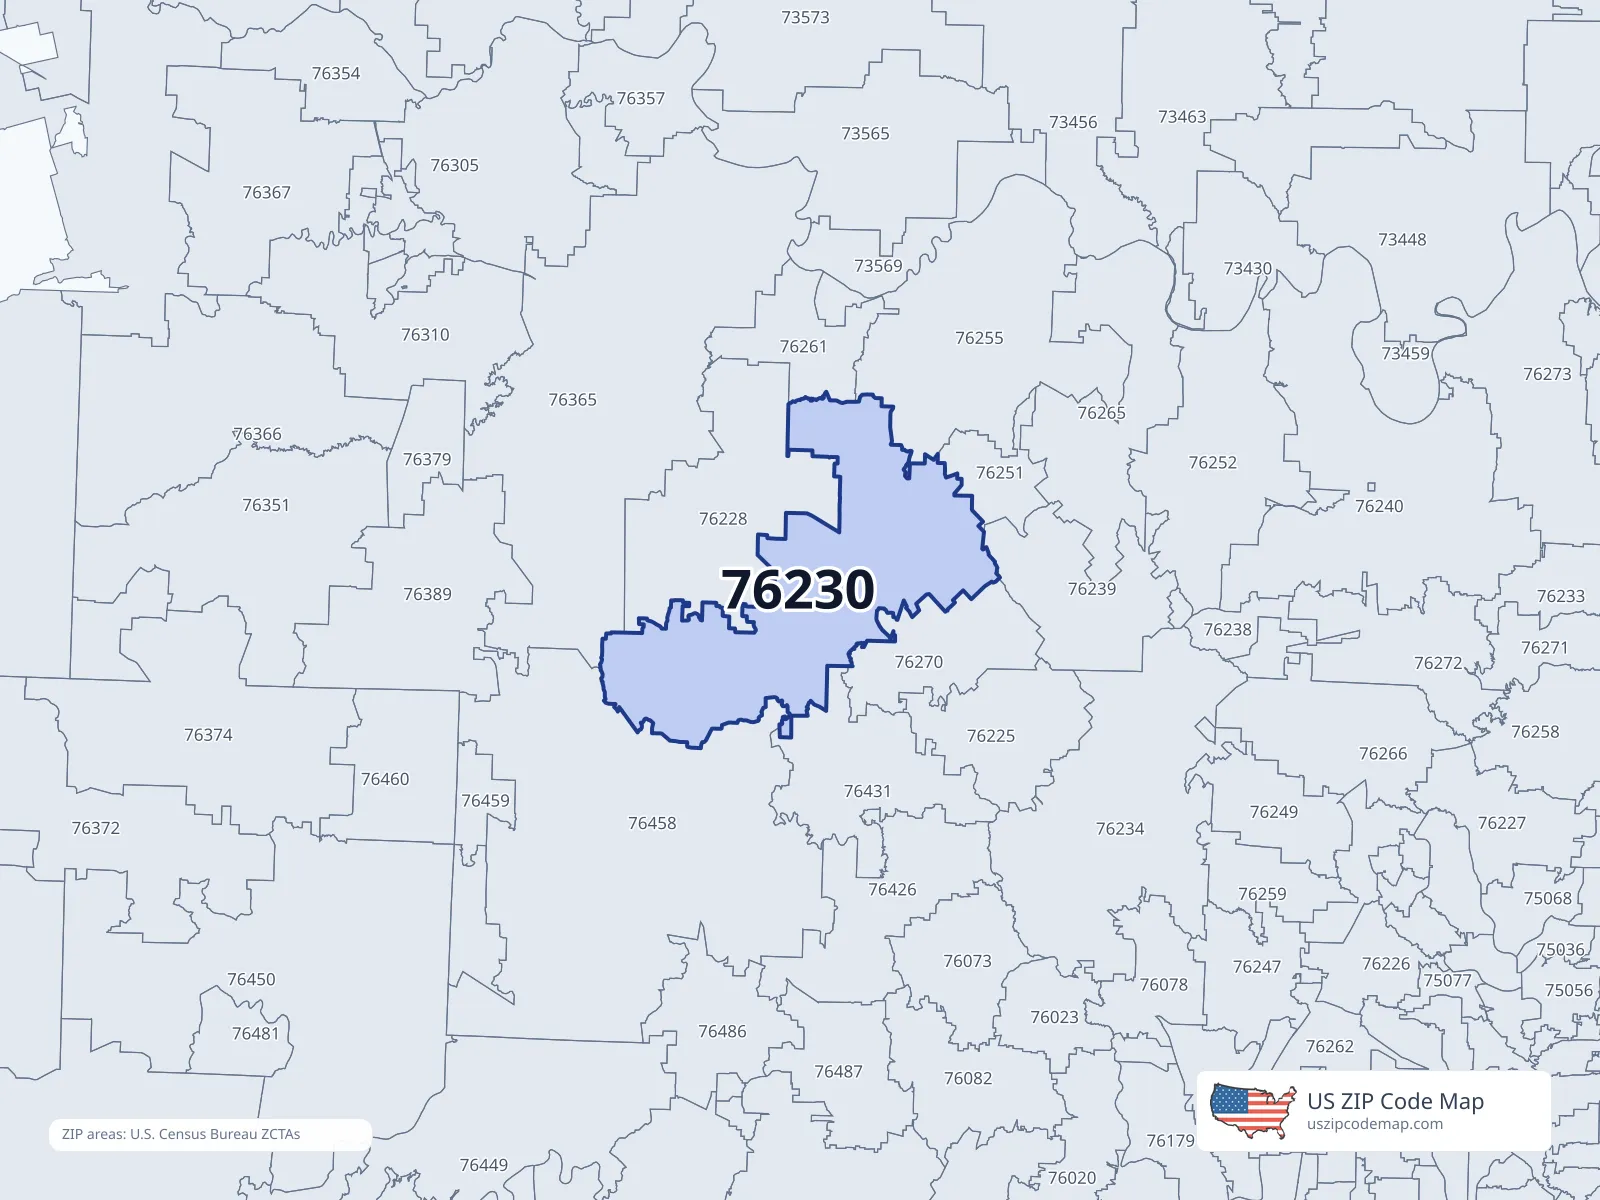
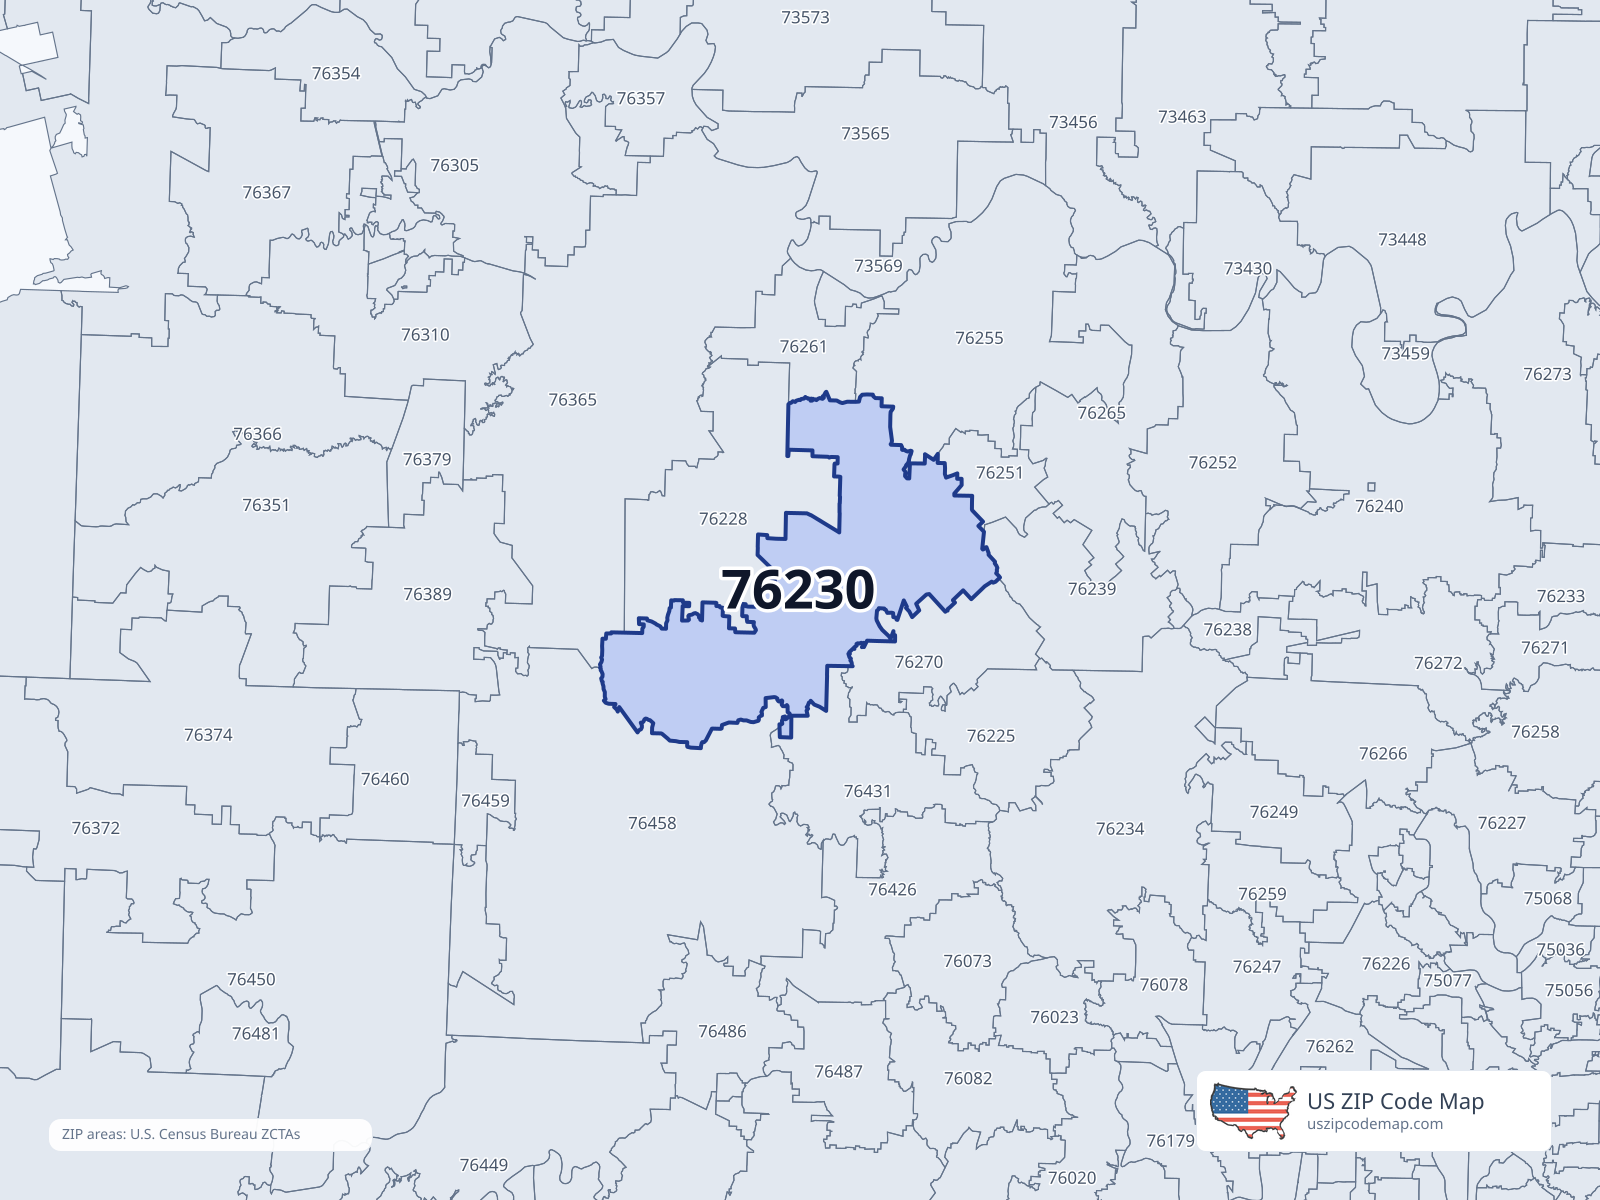
ZIP code map of 76230
About ZIP code 76230
More enterprise fields
Commercial ZIP directory · not ACS
Commercial ZIP directory population_count for ZCTA 76230. Not ACS. Methodology
People in 76230
Race
- White8,546
- Black or African American46
- American Indian or Alaska Native88
- Asian46
- Native Hawaiian and Pacific Islander2
- Other race334
- Two or more races930
Hispanic or Latino (any race): 1,211
Age
- Under 101,219
- 10 to 191,314
- 20 to 29935
- 30 to 391,150
- 40 to 491,099
- 50 to 591,358
- 60 to 691,401
- 70 to 79995
- 80 and older521
Income and housing in 76230
Education
- High school graduate87.1%
- Bachelor's degree16.1%
- Graduate degree3.9%
Places covering 76230
Cities and places — Population overlap
Share of this ZIP/ZCTA’s population located within each place, based on ZIP Code Database place-overlap data. This is a population measure, not land-area overlap or the Census-place population.
- Bowie54.5%
ZIP Code Database place-overlap table, field percent_of_zip_population_in_place, keyed by place_geoid. Not ACS 2019–2023. Overlap vintage is the shipped overlap table and is separate from ACS. Methodology
Counties — Population overlap
Share of this ZIP/ZCTA’s population located within each county, based on ZIP Code Database county-overlap data. This is a population measure, not land-area overlap or the Census county population.
- Montague County96.4%
- Jack County2.2%
- Clay County1.4%
ZIP Code Database county-overlap table, field percent_of_zip_population_in_county, keyed by county_geoid. Not ACS 2019–2023. Overlap vintage is the shipped overlap table and is separate from ACS. Methodology
45.5% of this ZIP is outside city limits (a real overlap row, not missing data).
Population history for 76230
Hover the chart or read the table below (Year | ACS | IRS).
| Year | ACS population | IRS population |
|---|---|---|
| 2005 | 8,716 | |
| 2006 | 8,530 | |
| 2007 | 9,455 | |
| 2008 | 8,715 | |
| 2009 | 8,800 | |
| 2010 | 8,635 | |
| 2011 | 10,065 | 8,711 |
| 2012 | 9,898 | 8,590 |
| 2013 | 9,827 | 8,650 |
| 2014 | 9,579 | 8,490 |
| 2015 | 9,431 | 8,540 |
| 2016 | 9,390 | 8,410 |
| 2017 | 9,538 | 8,530 |
| 2018 | 9,762 | 8,530 |
| 2019 | 9,896 | 8,710 |
| 2020 | 9,633 | 8,810 |
| 2021 | 9,921 | 9,040 |
| 2022 | 9,742 | 9,060 |
| 2023 | 9,885 |
ACS: U.S. Census Bureau American Community Survey 5-year estimates. IRS: Statistics of Income ZIP Code data.
ZIP codes near 76230
12 nearest ZIP centroids (any distance)
- 76228Bellevue9.9 miPop 1,320 · Income $71,250
- 76270Sunset10.9 miPop 2,252 · Income $77,552
- 76431Chico15.7 miPop 4,480 · Income $82,971
- 76251Montague17.0 miPop 704 · Income $59,423
- 76225Alvord18.4 miPop 3,311 · Income $71,625
- 76261Ringgold18.7 miPop 203 · Income $39,375
- 76239Forestburg20.5 miPop 1,201 · Income $65,000
- 76365Henrietta22.7 miPop 4,668 · Income $64,307
- 76255Nocona23.4 miPop 5,725 · Income $55,052
- 76426Bridgeport25.7 miPop 11,065 · Income $84,759
- 76458Jacksboro26.0 miPop 6,103 · Income $62,969
- 76265Saint Jo26.3 miPop 1,634 · Income $77,902
ZIP centroids within 2 miles
No other ZIP codes within 2 miles of 76230, measured by Census internal-point centroids. Try a wider radius.
ZIPs within 2 miles of this place
Default is 2 miles. Distances are between ZIP centroids. Widen the radius if nothing is in range.
ZIP code 76230 FAQ
- What city is ZIP code 76230 in?
- 76230 is in Bowie, TX.
- What county is 76230 in?
- 76230 is in Montague County.
- What is the median household income in 76230?
- The median household income in 76230 is $64,467.
- Which ZIP codes are near 76230?
- Use the radius tool on this page to list ZIP codes within a chosen distance of 76230.